In a previous post, I discussed the need for historical prospective. Many inadequacies of the current state of investment reporting can be traced to only showing information as of a point in time.

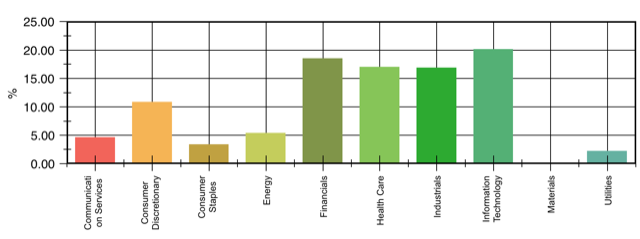
If your product merely shows the portfolio’s current sector composition, like the graph above, then you’re lacking any sort of frame of reference. In the prior post, I recommended including an additional graph showing historical sector changes to give users a perspective.
In this post, I’ll discuss an alternative method; one that you currently personally use on a daily basis.
Historical perspective through animated time-series
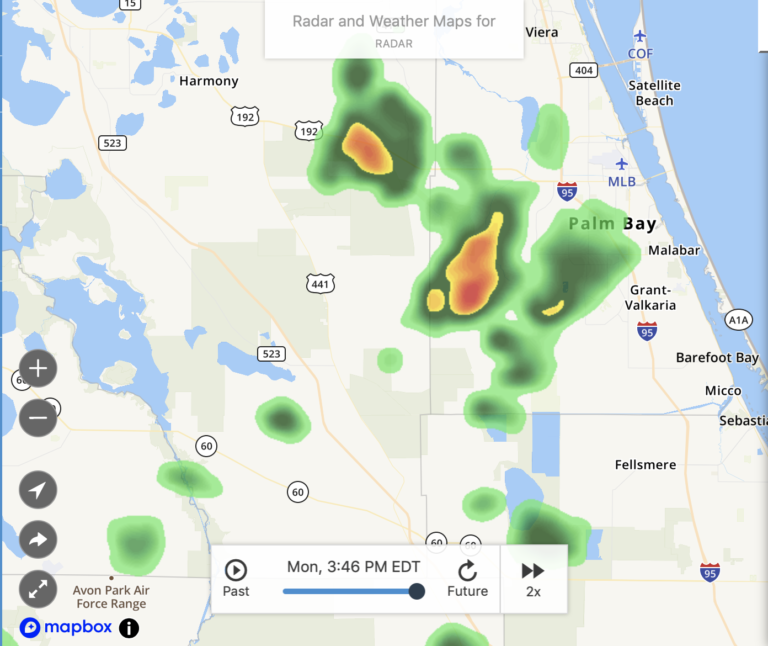
Although “animated time series” seems like some esoteric academic theory, in fact you use its application when you check the weather. When initially viewing a radar map , you see the current atmospheric conditions, as shown below:

For most people, instinctively this information is incomplete.
Yes, the current cloud cover is important, but you also need the direction and speed of the clouds in order to make intelligent decisions. In other words, they need a frame of reference/historical prospective to get a complete understanding. To do that they press the “play” button to see the cloud movement.
The above video is the result of taking the historical positions of the clouds and generates a movie, or in other words, an animated time series. With this video, you can ascertain the direction and speed of the clouds which gives you a complete picture of the atmosphere.
The same technique can be applied to presenting portfolio composition. By giving the user the option to view the sector breakdown over a period of time as a video they get the necessary perspective to fully understand the sector makeup.
In conclusion, it’s imperative to give readers a historical perspective in order for them to fully understand their investments. Ultimately it is your decision, as the FinTech developer, which method is most appropriate for the application.
If you want to see this in action, download my app Investaware. You’ll get a complete view of your sectors along with a better understanding of your portfolio and how it’s being managed.
