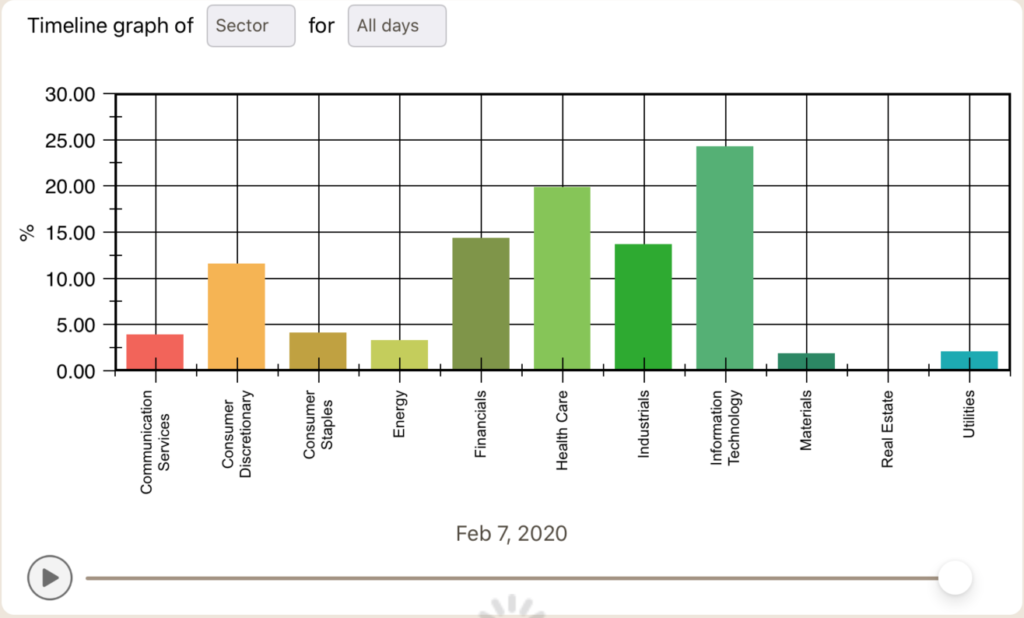
The composite page lets you analyze the changes in portfolio’s investment class break-down or the equities sector components based upon a time frame that you choose.
The page contains 2 sections. The first section allows you to choose what to analyze and the time frame. It also presents an animated graph that shows the changes as days lapse. For more information about the animated graph see the blog post “An alternative approach to historic perspective“.
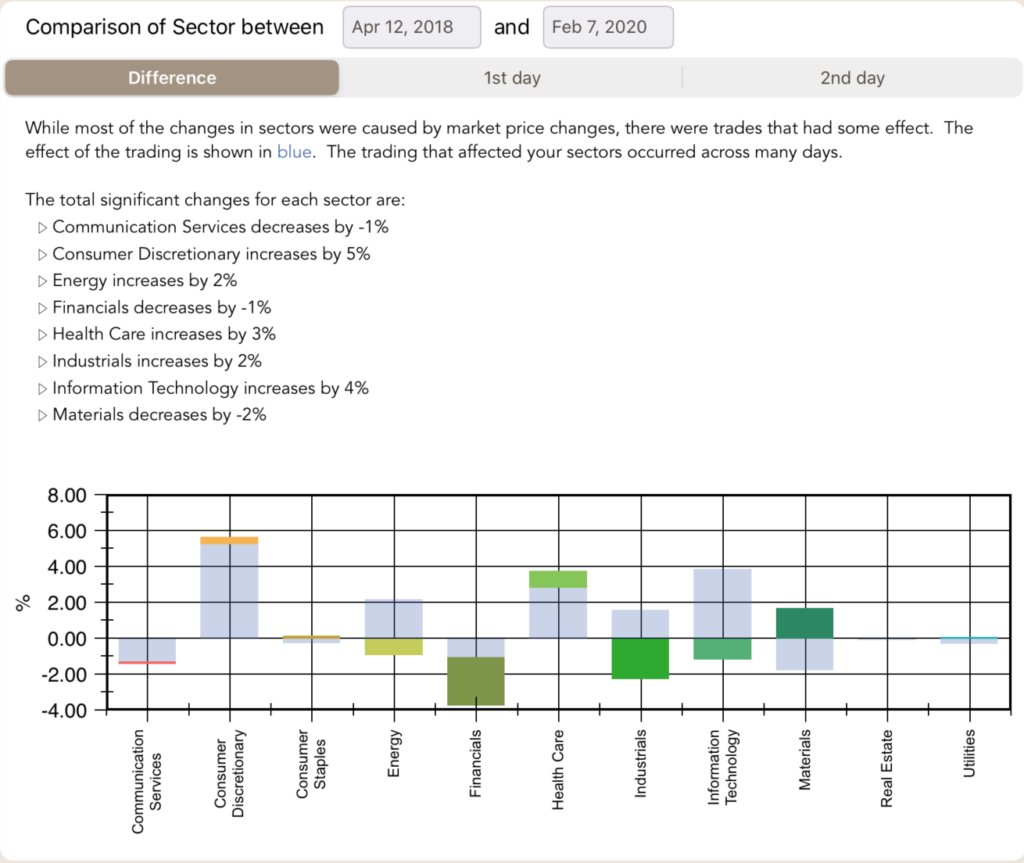
Comparison Detail
As an alternative to the animated timeline graph, this section shows the changes with 3 separate graphs:
the difference between the timeframe’s start and end dates,
the composition as of the start date,
the composition as of the end date.
In addition, when analyzing sectors, it will also describe the changes associated with trades (as opposed to changes from market value fluctuations).