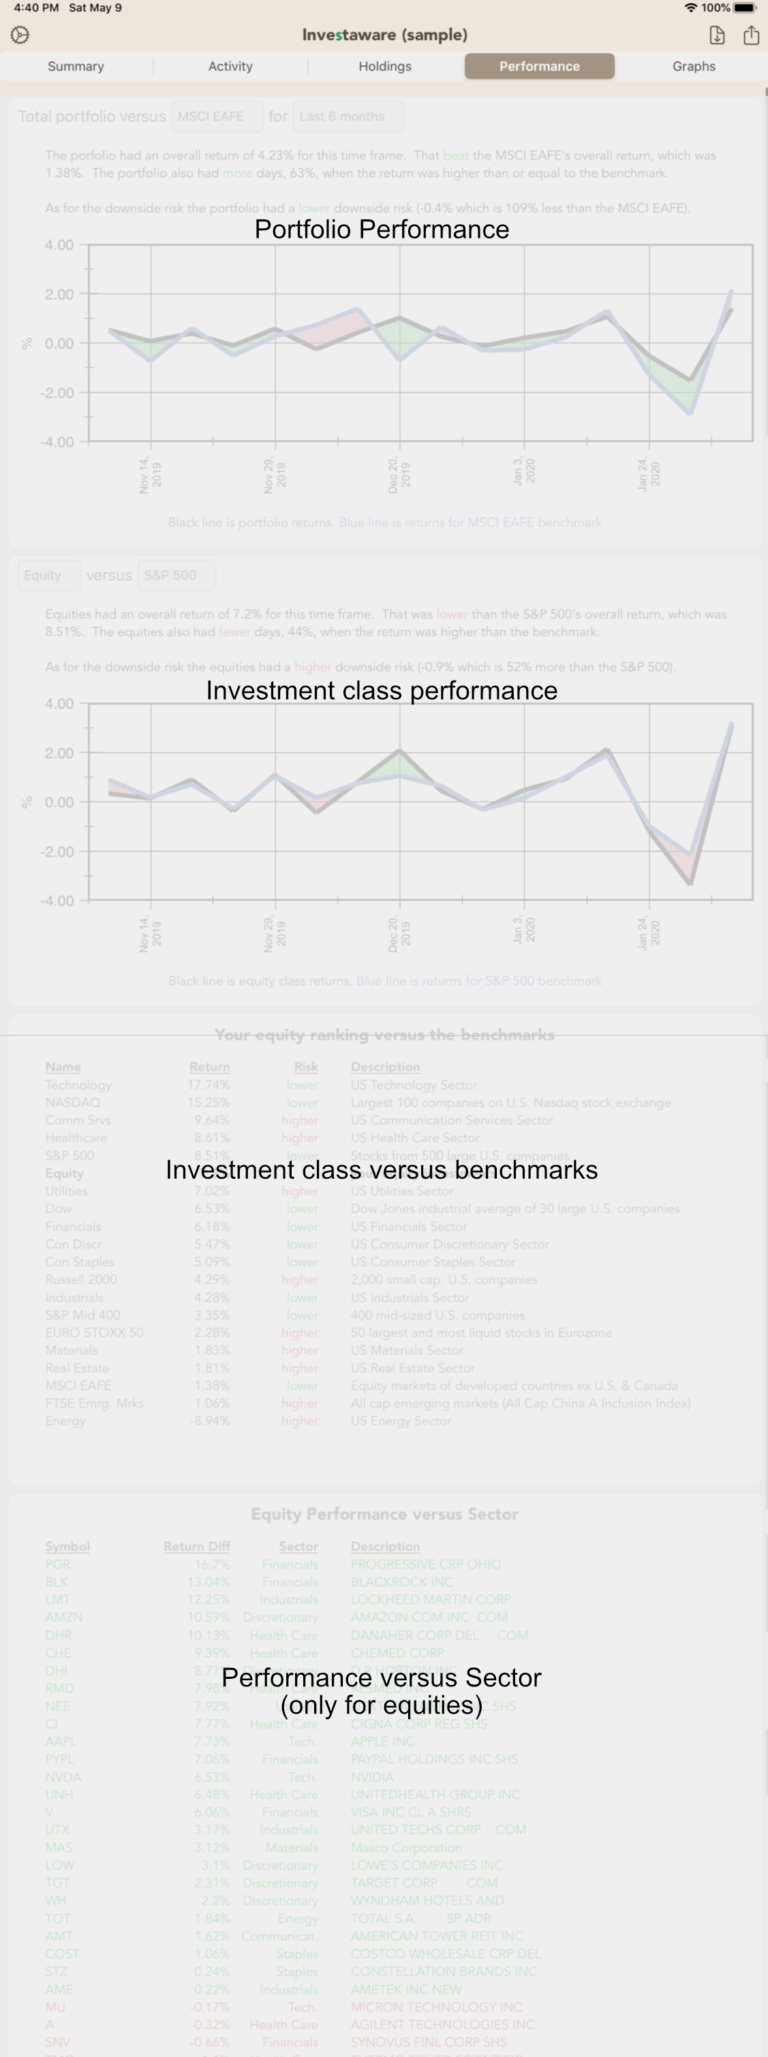
The performance page displays a variety of graphs and metrics regarding the profitability of the portfolio, its inherit risk and compares it to a variety of benchmarks.
The page actually consists of 5 sections:
Portfolio performance
Investment class performance
Investment class versus benchmarks
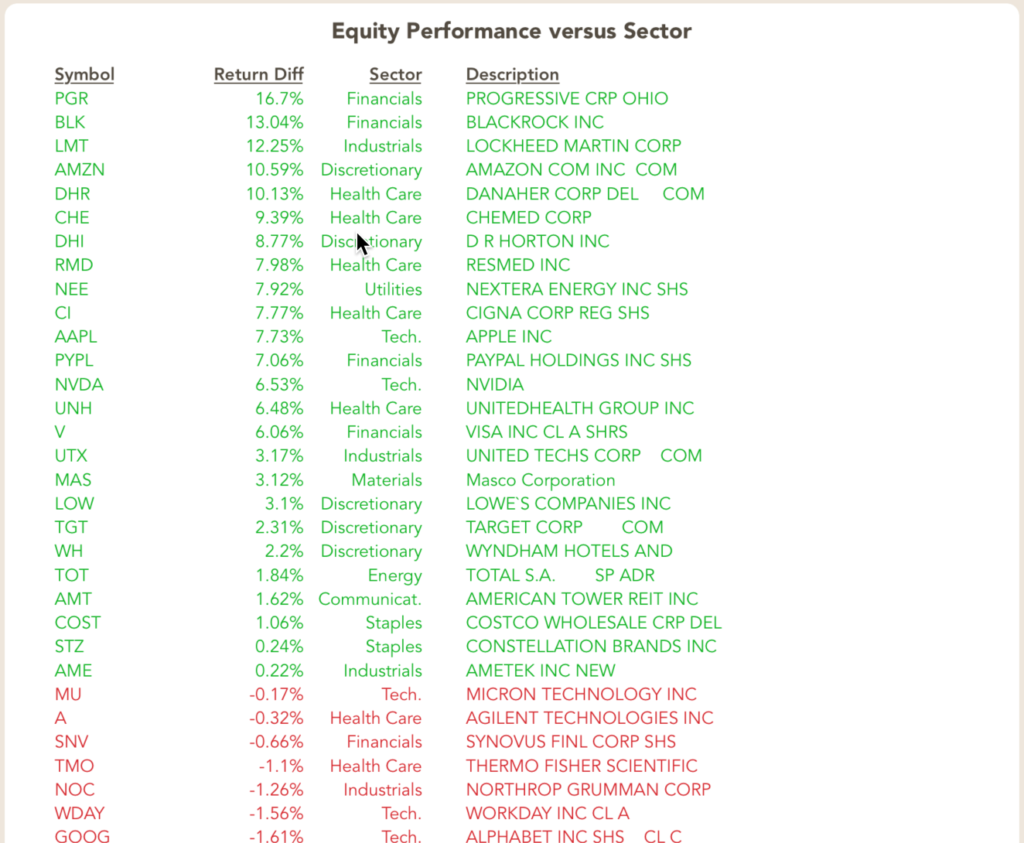
Performance versus sector (displayed only when Equities are selected as the investment class)
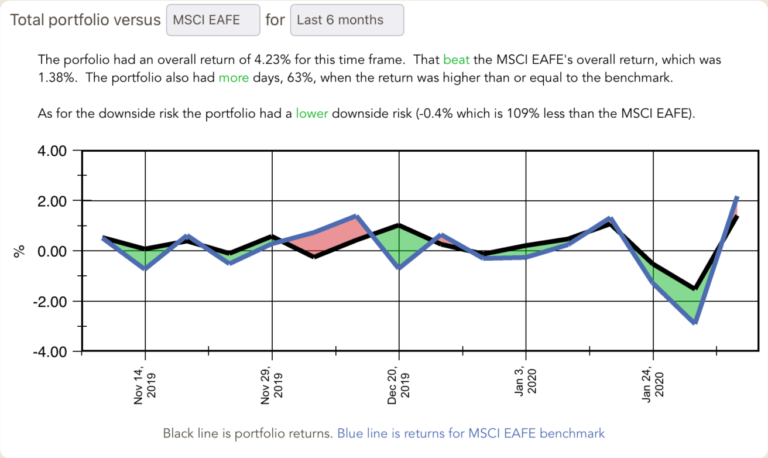
Portfolio performance
The first section displays a graph of the portfolio versus the default benchmark. It also allows you to choose a timeframe (which is used for all the other sections on the page).
The description on the section also includes the risk associated with the portfolio and compares it to the benchmark.
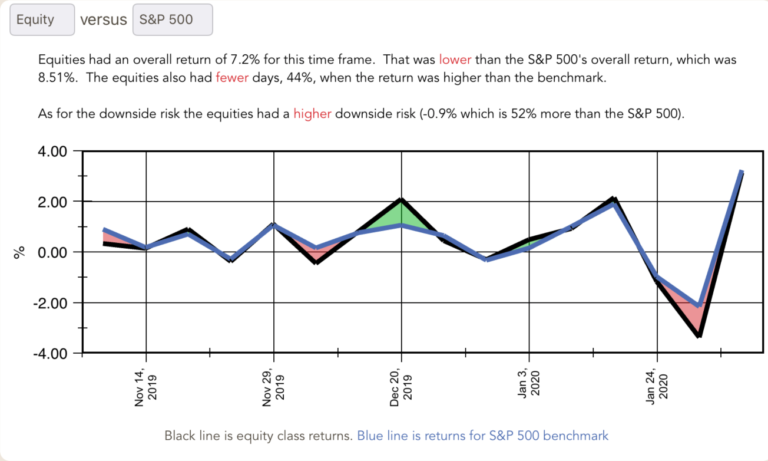
Investment class performance
The 2nd section allows you to choose an investment class to examine and compares it to its associated benchmark.
Similar to the above section, it also describes the risk associated with the class and compares it to the risk of inherent with the benchmark.
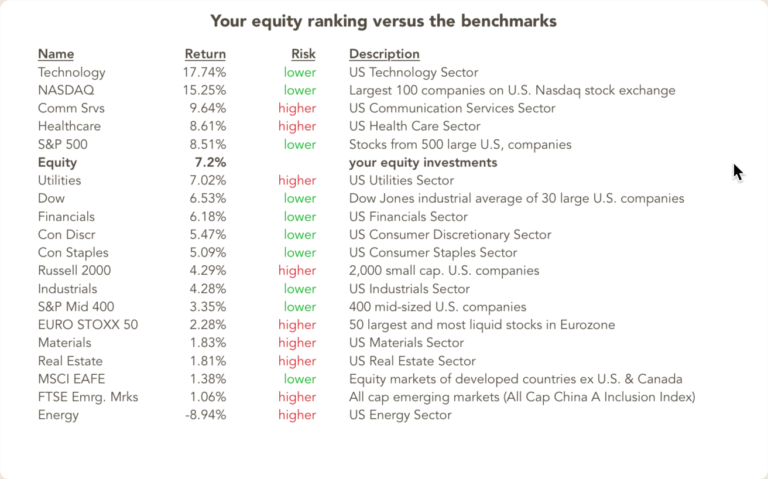
Investment class versus benchmarks
Investaware stores a variety of benchmarks. In this section it compares the total performance of the selected class (for the time frame selected in the first section). It also shows whether that class had a higher or lower risk when compared to the benchmarks.
Equity performance versus sector
If equities are the selected class, then the page will show an additional section which compares each equity investment to its sector.