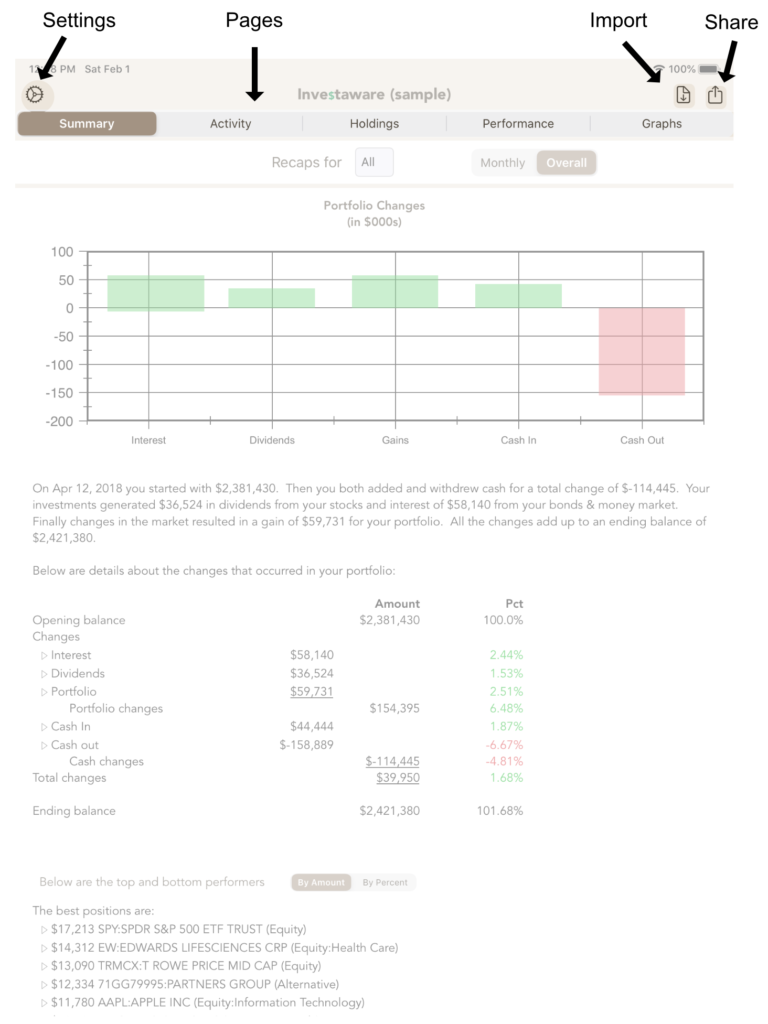
Main Screen
At the top of the app’s screen you’ll see controls that allow you to:
- Open the settings screen (which also contains logs and this help file),
- Page tabs, including:
- Summary – presents the monthly, yearly, or inception to date narrative of how your portfolio did — avoiding typical industry jargon.
- Activity – shows a summary of any daily transactions, which you can drill down to individual trades,
- Holdings – displays positions as a given import date. You can also view the positions by investment or use a heat-map to visualize the changes,
- Performance – presents the rate of return and risk associated with the portfolio. You can also compare performance to a variety of indexes,
- Graphs – displays the components of the portfolio using a variety of graphs.
- Import – allows you to import a variety of files (containing both positions as well as activity),
- Share – exports the current screen.
