As part of the analysis that Investaware does on your portfolio, the application generates a narrative describing how the portfolio did over the time frame you specify. These simple (no jargon) commentaries are found on the Summary screen.
By reading the summaries, you can find out how much money you made as well as what were the investments that made the largest impact.
The overview summary also shows a simple table with all the gains and losses.
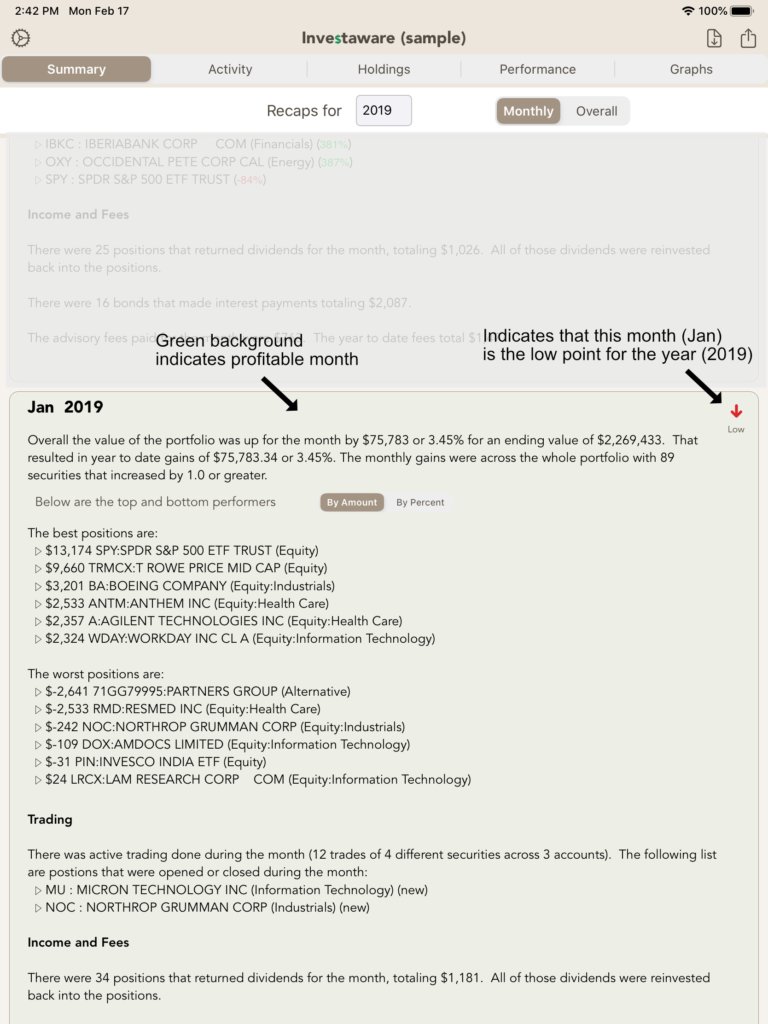
For the monthly summaries, each month is colored to indicate profitable months (which have a green background) and which months ended with a loss (which have a red background). The monthly summaries will also indicate which month is the high point (portfolio had the most value) and the low point (portfolio had the lowest value).
The recaps for the month are presented in 3 sections:
The first paragraph is a general discussion on how the portfolio did overall for the month. This section also includes the top winners and losers for the month.
The next section discusses how active the trading was for the month and highlights any new positions, closed positions, and positions that had significant trading.
The final section discusses dividends, interest, and brokerage fees. This will show you the year’s cumulative fees that you’ve paid your advisor.